Daily Rate Summary
Tuesday, November 14th, 2017
Mortgage Rates and Treasury Yields Mixed.
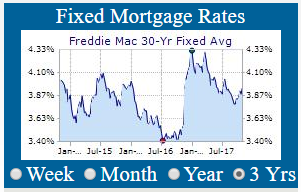
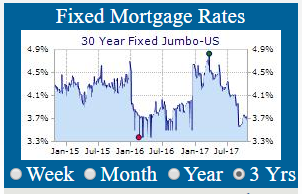
On Monday, Treasury bond yields and Mortgage interest rates were mixed as the Senate thrashes out more details of the Tax Bill to be sent to the House. Slowly, the Federal Reserve is beginning to see the signs of inflation emerge and today’s Producer Price Index shows 2.8% (YoY) increase. Nervous investors mull economic signals and the impact of the Tax cut on economic growth potential. Bond investors are looking at the possibility of lower-for-longer policy as an incentive to buy bonds. Treasury Note stood at a yield of 2.4055% and the 30 Yr. U.S. Treasury Bond is yielding 2.8710%. 30 Year Mortgages according to Freddie Mac were around 3.90% for conforming and 3.70% for Jumbo products.
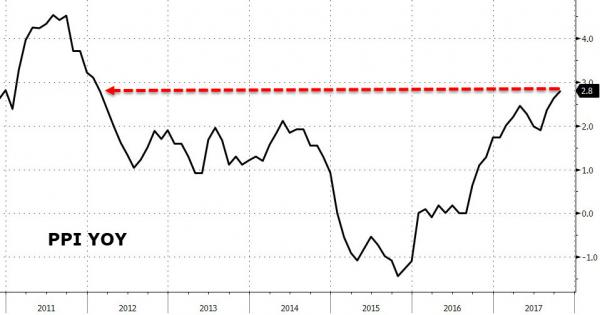
The Conference Board’s Producer Price Index (PPI) in October came in at 2.80% annual rate showing steadily increasing inflation at the Producer level year-over-year. As Zerohedge.com highlights; “Following September's hotter-than-expected Core PPI (and 5Y high in PPI), October was expected to see a modest slowdown but headline PPI printed a massive 2.8% YoY (smashing the 2.4% exp). This is the hottest PPI since January 2012, which was driven by surges in fuel prices and prescription drugs.”
Conference Board’s Producer Price Index (PPI) Rise at 2.80% (YoY).
(Chart courtesy of Zerohedge.com).
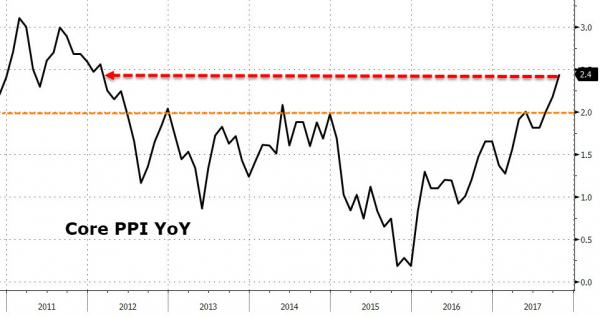
According to the Board, “The report showed that Core PPI also beat expectations, rising 2.4% YoY (vs 2.2% exp) - also the highest since February 2012.
Conference Board’s Core Producer Price Index (PPI) Rise at 2.40% (YoY).
(Chart courtesy of Zerohedge.com).
Nearly half of the increase in prices for final demand services can be attributed to margins for fuels and lubricants retailing, which surged 24.9 percent. Almost half of the rise in the final demand goods index was the result of higher prices for pharmaceutical preparations, which increased 2.1 percent.
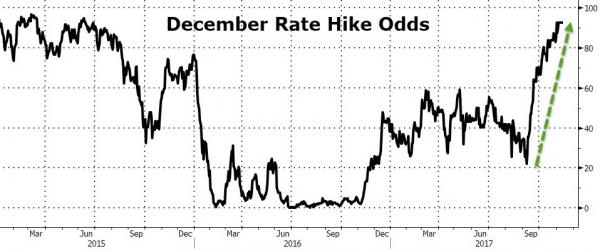
December rate-hike odds were at 97.1% right before the PPI print.”
30 Year U.S. Treasury Bond Yield Testing range back above 2.85%.
(Chart courtesy of Zerohedge.com).
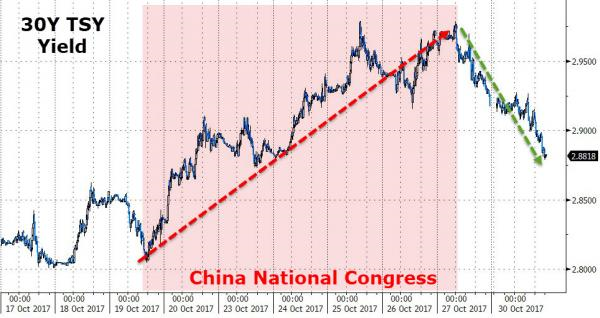
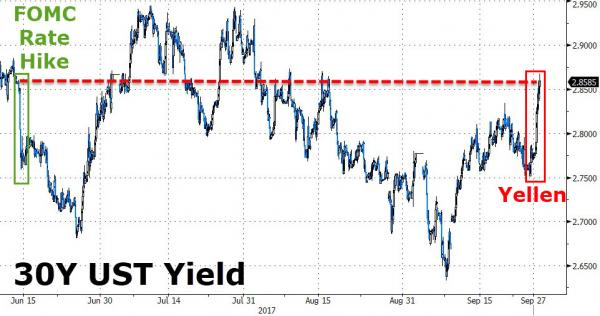
The 30 Year U.S. Treasury Bond has now tested the lows and returned to 2.80% and back again to the starting point since the market moving comments from ECB President, Mario Draghi regarding the tapering of bond purchases in late-2018.
10 Year U.S. Treasury Note Yield Rises to 2.4055%.
(Chart courtesy of Zerohedge.com).
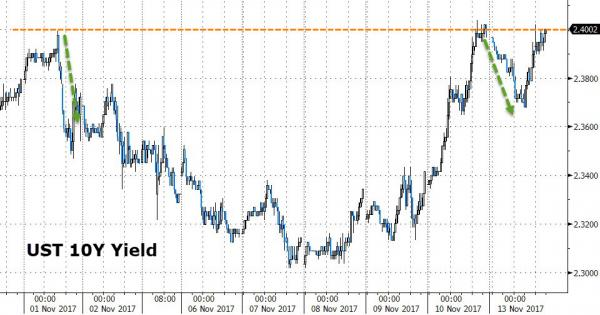
The 10 Year U.S. Treasury Note has tested the lows and is moving back to the upper trading range in bond yields. We await whether that gap at 2.05% will get filled in coming weeks. If so, we will get another run at historically low rates before the final blow-off in Credit Markets sends Mortgage Interest rates up for good.
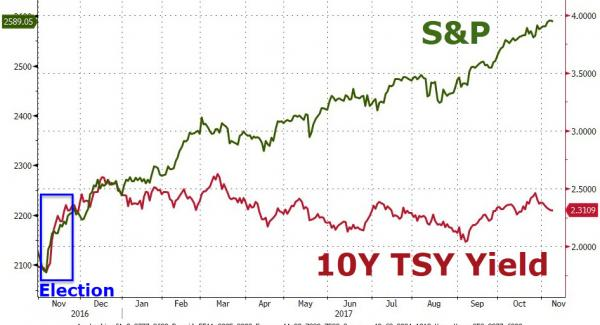
10 Year U.S. Treasury Note Yield Longer-term View back above 2.35% again.
(Chart courtesy of Zerohedge.com).
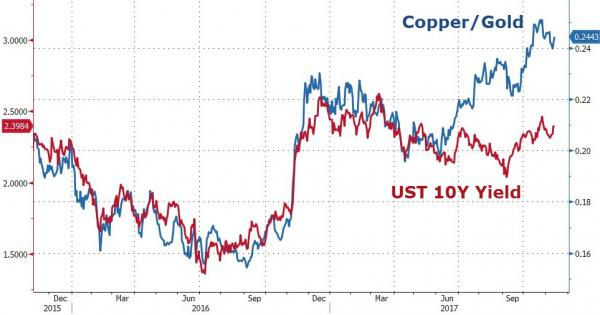
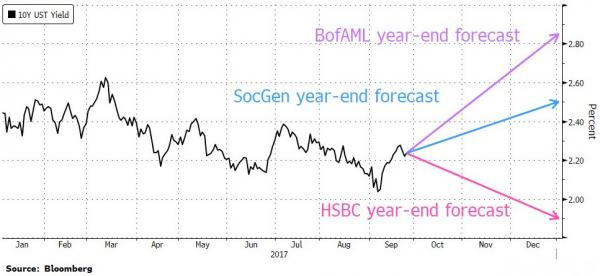
The above Chart does suggest that a constructive set-up is forming in the 10 Year Treasury Note with the potential to push the yield to around 2.00% over the next month. It is crucial that Mortgage Rates stay at or below 4.00% or demand for mortgage loans will dry up. The window of opportunity for borrowers seeking mortgage refinancing & home purchases is still open for now.
December Fed Funds Futures Rate Hike Odds Rise above 97%.
(Chart courtesy of Zerohedge.com).
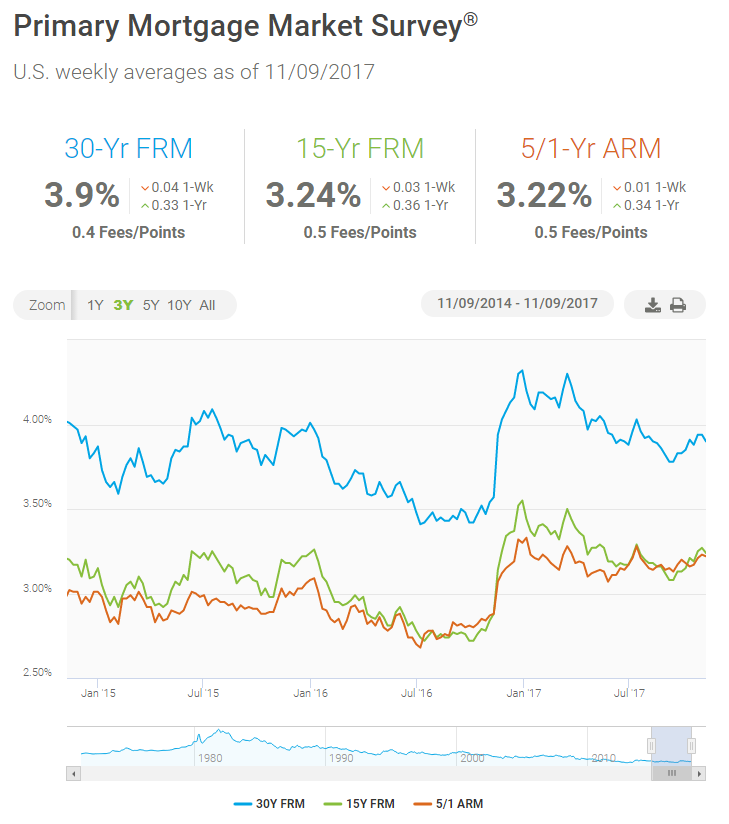
As can be seen from Freddie Mac’s Mortgage Market Survey, last week, 30 Yr. Fixed Mortgage rates for conforming loans hit 3.90% lower by 4 basis points (bps) from the previous week.
Treasury Prices and Yields Mixed for U.S. 10 Yr. and 30 Yr. Treasuries.
At the Chicago Board of Trade (CBOT): the US 10 Year Treasury Note futures Contract for December settlement closed at a price of 124’20 / 32nds; the 10 Year Note was down 2.5 basis points (bps) on the day, yielding 2.4055%. The US 30 Year Treasury Bond futures Contract for December settlement closed at a price of 152’13 / 32nds; the 30 Year Bond was up 3 basis points (bps) on the day, yielding 2.8710%. Mortgage Rates are just off their 2017 lows and are lower by 4 basis points (bps) from the previous Freddie Mac Survey last week.
Thanks to ZeroHedge.com, The Conference Board, Federal Reserve Bank, BofA Merrill Lynch Global Research, Goldman Sachs, Bloomberg, and FreddieMac.com for Charts and Graphics.
Disclaimer: The Information & content in this message is solely the opinion of the author and believed to be from reliable sources. Charts and tables contained herein were taken from other sources and a best effort was attempted by the author to give attribution where possible. None of this material should be construed as fact, and is not intended for use by reader as investment advice or relied upon for making financial decisions.

Get the Updated and Improved Mortgage Rates App from ERATE.com

- Why housing consumers say you need a real estate agent
- Lenders Double Down on Car-Title Loans Attempting to Stay Ahead of Regulators
- Need Cash Fast? Beware of Greedy Lenders Waiting to Exploit You
- Mortgage Rates and the Stock Market: Understanding the Relationship
- The ERATE® Resource Guide to No-Closing-Cost Refinancing
- You and Your Credit; Make it a Happy Ongoing Relationship
- Principal Reduction: New Programs, More Controversy
- Understanding Mortgages: Mortgage Paperwork
- What is Mortgage Interest?
- Mortgage Terms & Definitions
- Understanding Mortgages: Types of Mortgages
- Understanding Mortgages: How to Get a Mortgage
- What is a Short Sale?
- Understanding Mortgages: Buy or Rent?
- Understanding Mortgages: Working with a Real Estate Agent
- Understanding Mortgages: Working with a Real Estate Agent
- Understanding Credit Cards: Top Mistakes
FREE Mortgage Rate Widgets
Your State's Rates or National Rates Get this Widget for any State you want