Daily Rate Summary
Monday, June 26, 2017
Mortgage Rates Steady Treasury Yields Unchanged.
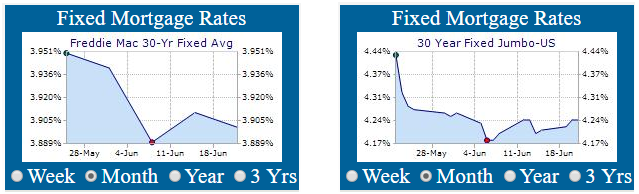
On Friday, Treasury bond yields were steady and interest rates remained near the lowest levels so far for 2017. Mortgage Rates (despite the Fed June Rate Hike of 0.25%) have fallen nearly to the lowest levels of the year. The September 10 Yr. U.S. Treasury Note stood at a yield of 2.1423% and the 30 Yr. U.S. Treasury Bond yielded 2.6853%. 30 Year Mortgages according to Freddie Mac were around 3.89% for conforming and 4.23% for Jumbo products.
Since the March 15th meeting of the FOMC, Credit Spreads have significantly narrowed and the Treasury complex has continued to price in a deterioration of the US Macro Conditions in June (see Chart below). This has extended the lower-for-longer narrative and created a window of opportunity for borrowers seeking mortgages for refinances & new home purchases as Mortgage rates stay at low levels.
U.S. Macro Surprise Index vs S&P 500 Index (Courtesy of Zerohedge.com)
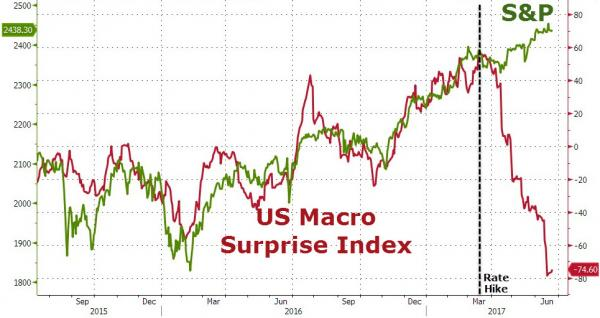
In June, the U.S. Macro Surprise Index continued to deteriorate as economic conditions worsened to a reading of -74.60 from -44.2 in the month of May. Since March, the Federal Reserve has seen economic activity slow but has followed a plan of gradual 0.25% point Fed Funds rate hikes. The questions is who is right the Fed or the Bond Markets?
Chicago Fed National Activity Index (Courtesy of Zerohedge.com)
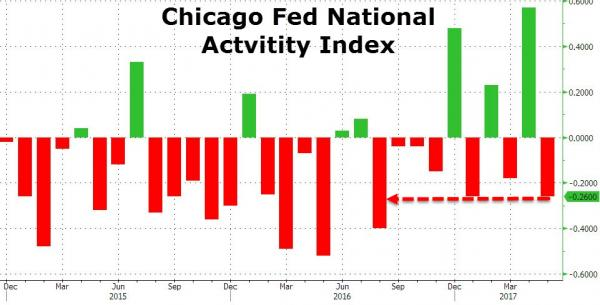
The Chicago Fed National Economic Activity Index plunged to -0.26 in May - the biggest drop since August 2016. (see Chart above). As displayed, this indicator is highly volatile on a month-to-month basis so far in 2017. The index draws on 85 economic indicators, and only 32 of the 85 monthly individual indicators made positive contributions.
G3 Central Bank Balance Sheet, Nasdaq, UST 2yr vs 30yr Spread, U.S. Macro and WTI Crude Prices (Courtesy of Zerohedge.com)
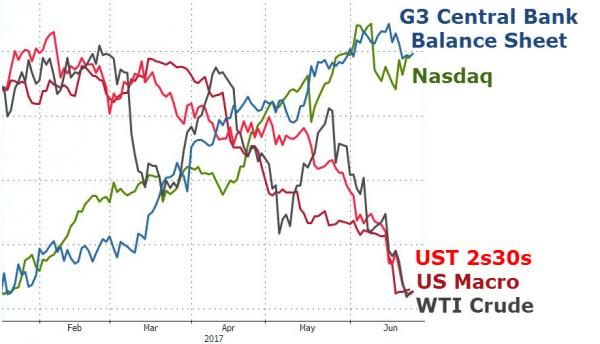
The S&P 500 and the Nasdaq are ignoring (since the GFC began and extraordinary CB intervention began, i.e. QE forever) the indicators of weak U.S. Economic Conditions; in favor of following the worldwide Central Bank liquidity injections for higher stock prices; setting up a false narrative of recovery, growth, & stability that will soon crumble.
Weekly Mortgage Rates Analysis
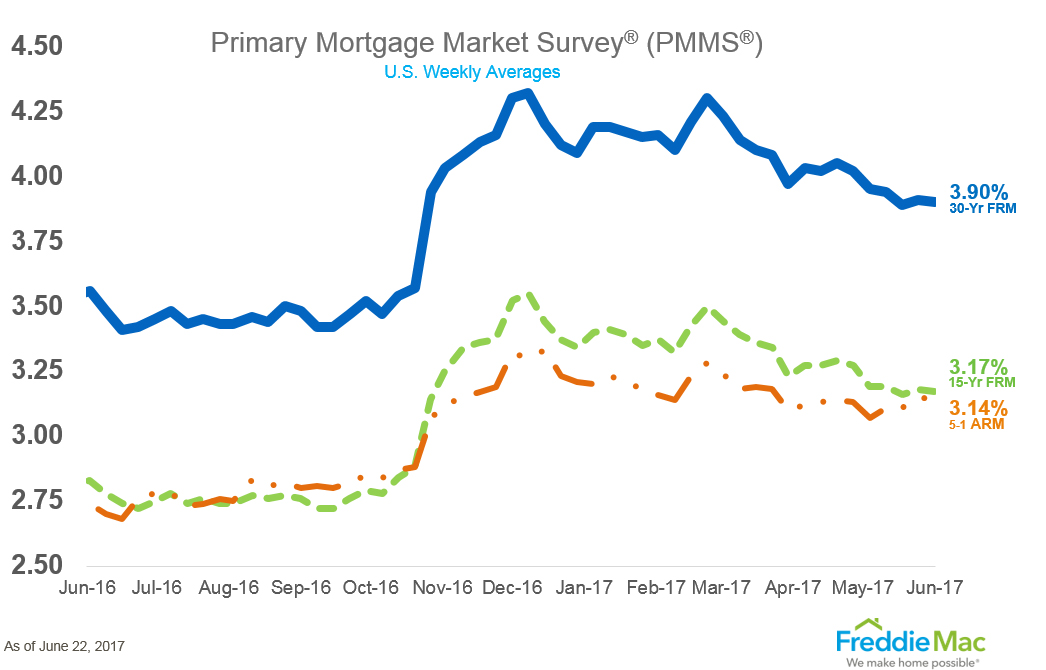
As can be seen from Freddie Mac’s Mortgage Market Survey, last week, 30 Yr. Fixed Mortgage rates for conforming loans hit 3.90% inching down 0.01% basis point from last week.
Treasury Prices Rise and Yields Fall for U.S. 10 Yr. and 30 Yr. Treasuries.
At the Chicago Board of Trade (CBOT): the US 10 Year Treasury Note futures Contract for September settlement closed at a price of 126’.23.5 / 32nds; the 10 Year Note was up 0.2 basis points (bps) on the day, yielding 2.1423%. The US 30 Year Treasury Bond futures Contract for Sept. settlement closed at a price of 156’20 / 32nds; the 30 Year Bond was up 5 basis point (bps) on the day, yielding 2.6853%. Mortgage Rates are near their lowest point so far in 2017, down -0.01% bps from the previous Freddie Mac Survey last week.
Thanks to ZeroHedge.com and FreddieMac.com for Charts and Graphics.
Disclaimer: The Information & content in this message is solely the opinion of the author and believed to be from reliable sources. Charts and tables contained herein were taken from other sources and a best effort was attempted by the author to give attribution where possible. None of this material should be construed as fact, and is not intended for use by reader as investment advice or relied upon for making financial decisions.

Get the Updated and Improved Mortgage Rates App from ERATE.com

- Why housing consumers say you need a real estate agent
- Lenders Double Down on Car-Title Loans Attempting to Stay Ahead of Regulators
- Need Cash Fast? Beware of Greedy Lenders Waiting to Exploit You
- Mortgage Rates and the Stock Market: Understanding the Relationship
- The ERATE® Resource Guide to No-Closing-Cost Refinancing
- You and Your Credit; Make it a Happy Ongoing Relationship
- Principal Reduction: New Programs, More Controversy
- Understanding Mortgages: Mortgage Paperwork
- What is Mortgage Interest?
- Mortgage Terms & Definitions
- Understanding Mortgages: Types of Mortgages
- Understanding Mortgages: How to Get a Mortgage
- What is a Short Sale?
- Understanding Mortgages: Buy or Rent?
- Understanding Mortgages: Working with a Real Estate Agent
- Understanding Mortgages: Working with a Real Estate Agent
- Understanding Credit Cards: Top Mistakes
FREE Mortgage Rate Widgets
Your State's Rates or National Rates Get this Widget for any State you want