7/1 Adjustable Rate Mortgage (7/1 ARM)
Adjustable Rate Mortgage
the rate is fixed for a period of 7 years after which in the 8th year the loan becomes an adjustable rate mortgage (ARM). The adjustable rate is tied to the 1-year treasury index and is added to a pre-determined margin (usually between 2.25-3.0%) to arrive at your new monthly rate. Ask what the margin, life cap and periodic caps of your ARM will be in the 8th year. The loan is fully amortized (or paid off) in 30 years if the normal payment schedule is followed. (Also see anatomy of an ARM for additional information).

7/1 ARM Rate Quotes
Other Loan Programs TooJust One Click = Today's Rate Chart

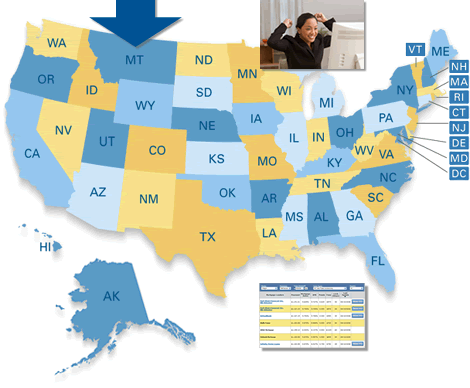
Start by selecting your state
1 Year T-Bill Index History
(Index often used with 7/1 ARM)
| Jan | Feb | Mar | Apr | May | Jun | Jul | Aug | Sep | Oct | Nov | Dec | |
|---|---|---|---|---|---|---|---|---|---|---|---|---|
| 2016 | 0.54 | 0.53 | 0.66 | 0.56 | 0.59 | 0.55 | 0.51 | 0.57 | 0.59 | 0.56 | ||
| 2015 | 0.20 | 0.22 | 0.25 | 0.23 | 0.24 | 0.28 | 0.30 | 0.38 | 0.37 | 0.26 | 0.48 | 0.65 |
| 2014 | 0.12 | 0.12 | 0.13 | 0.11 | 0.10 | 0.10 | 0.11 | 0.11 | 0.11 | 0.10 | 0.13 | 0.21 |
| 2013 | 0.15 | 0.16 | 0.15 | 0.12 | 0.12 | 0.14 | 0.12 | 0.13 | 0.12 | 0.12 | 0.12 | 0.13 |
| 2012 | 0.12 | 0.16 | 0.19 | 0.18 | 0.19 | 0.19 | 0.19 | 0.18 | 0.18 | 0.18 | 0.18 | 0.16 |
| 2011 | 0.27 | 0.29 | 0.26 | 0.25 | 0.19 | 0.18 | 0.19 | 0.11 | 0.10 | 0.11 | 0.11 | 0.12 |
| 2010 | 0.35 | 0.35 | 0.40 | 0.45 | 0.37 | 0.32 | 0.29 | 0.26 | 0.26 | 0.23 | 0.25 | 0.29 |
| 2009 | 0.44 | 0.62 | 0.64 | 0.55 | 0.50 | 0.51 | 0.48 | 0.46 | 0.40 | 0.37 | 0.31 | 0.37 |
| 2008 | 2.71 | 2.05 | 1.54 | 1.74 | 2.05 | 2.42 | 2.28 | 2.18 | 1.91 | 1.42 | 1.07 | 0.49 |
| 2007 | 5.06 | 5.05 | 4.92 | 4.93 | 4.91 | 4.96 | 4.96 | 4.47 | 4.14 | 4.10 | 3.50 | 3.26 |
| 2006 | 4.45 | 4.68 | 4.77 | 4.90 | 5.00 | 5.16 | 5.22 | 5.08 | 4.97 | 5.01 | 5.01 | 4.94 |
| 2005 | 2.86 | 3.03 | 3.30 | 3.32 | 3.33 | 3.36 | 3.64 | 3.87 | 3.85 | 4.18 | 4.33 | 4.35 |
| 2004 | 1.24 | 1.24 | 1.19 | 1.43 | 1.78 | 2.12 | 2.10 | 2.02 | 2.12 | 2.23 | 2.50 | 2.67 |
| 2003 | 1.36 | 1.30 | 1.24 | 1.27 | 1.18 | 1.01 | 1.12 | 1.31 | 1.24 | 1.25 | 1.34 | 1.31 |
| 2002 | 2.16 | 2.23 | 2.57 | 2.48 | 2.35 | 2.20 | 1.96 | 1.76 | 1.72 | 1.65 | 1.49 | 1.45 |
| 2001 | 4.81 | 4.68 | 4.30 | 3.98 | 3.78 | 3.58 | 3.62 | 3.47 | 2.82 | 2.33 | 2.18 | 2.22 |
| 2000 | 6.12 | 6.22 | 6.22 | 6.15 | 6.33 | 6.17 | 6.08 | 6.18 | 6.13 | 6.01 | 6.09 | 5.60 |
| 1999 | 4.51 | 4.70 | 4.78 | 4.69 | 4.85 | 5.10 | 5.03 | 5.19 | 5.25 | 5.43 | 5.55 | 5.84 |
| 1998 | 5.24 | 5.31 | 5.39 | 5.38 | 5.44 | 5.41 | 5.36 | 5.21 | 4.71 | 4.12 | 4.53 | 4.52 |
| 1997 | 5.61 | 5.53 | 5.80 | 5.99 | 5.87 | 5.69 | 5.54 | 5.56 | 5.52 | 5.46 | 5.46 | 5.53 |
| 1996 | 5.09 | 4.94 | 5.34 | 5.54 | 5.64 | 5.81 | 5.85 | 5.85 | 5.83 | 5.55 | 5.42 | 5.47 |
| 1995 | 7.05 | 6.70 | 6.43 | 6.27 | 6 | 5.64 | 5.59 | 5.75 | 5.62 | 5.59 | 5.43 | 5.31 |
| 1994 | 3.54 | 3.87 | 4.32 | 4.82 | 5.31 | 5.27 | 5.48 | 5.56 | 5.76 | 6.11 | 6.54 | 7.14 |
| 1993 | 3.50 | 3.39 | 3.33 | 3.24 | 3.36 | 3.54 | 3.47 | 3.44 | 3.36 | 3.39 | 3.58 | 3.61 |
| 1992 | 4.15 | 4.29 | 4.63 | 4.30 | 4.19 | 4.17 | 3.6 | 3.47 | 3.18 | 3.30 | 3.68 | 3.71 |
| 1991 | 6.64 | 6.27 | 6.40 | 6.24 | 6.13 | 6.36 | 6.31 | 5.78 | 5.57 | 5.53 | 4.89 | 4.38 |
| 1990 | 7.92 | 8.11 | 8.35 | 8.40 | 8.32 | 8.10 | 7.94 | 7.78 | 7.76 | 7.55 | 7.31 | 7.05 |
| 1989 | 9.05 | 9.25 | 9.57 | 9.36 | 8.98 | 8.44 | 7.89 | 8.18 | 8.22 | 7.99 | 7.77 | 7.72 |
| 1988 | 6.99 | 6.64 | 6.71 | 7.01 | 7.40 | 7.49 | 7.75 | 8.17 | 8.09 | 8.11 | 8.48 | 8.99 |
| 1987 | 5.78 | 5.96 | 6.03 | 6.5 | 7 | 6.8 | 6.88 | 7.03 | 7.67 | 7.59 | 6.96 | 7.17 |
| 1986 | 7.73 | 7.61 | 7.03 | 6.44 | 6.65 | 6.73 | 6.27 | 5.93 | 5.77 | 5.72 | 5.8 | 5.87 |
| 1985 | 9.02 | 9.29 | 9.86 | 9.14 | 8.46 | 7.8 | 7.86 | 8.05 | 8.07 | 8.01 | 7.88 | 7.68 |
The chart above is deemed reliable but accuracy is not guaranteed.
Get the Updated and Improved Mortgage Rates App from ERATE.com
- Why housing consumers say you need a real estate agent
- Lenders Double Down on Car-Title Loans Attempting to Stay Ahead of Regulators
- Need Cash Fast? Beware of Greedy Lenders Waiting to Exploit You
- Mortgage Rates and the Stock Market: Understanding the Relationship
- The ERATE® Resource Guide to No-Closing-Cost Refinancing
- You and Your Credit; Make it a Happy Ongoing Relationship
- Principal Reduction: New Programs, More Controversy
- Understanding Mortgages: Mortgage Paperwork
- What is Mortgage Interest?
- Mortgage Terms & Definitions
- Understanding Mortgages: Types of Mortgages
- Understanding Mortgages: How to Get a Mortgage
- What is a Short Sale?
- Understanding Mortgages: Buy or Rent?
- Understanding Mortgages: Working with a Real Estate Agent
- Understanding Mortgages: Working with a Real Estate Agent
- Understanding Credit Cards: Top Mistakes
FREE Mortgage Rate Widgets
Your State's Rates or National Rates Get this Widget for any State you want

