One Year Treasury Security
Adjustable Rate Mortgage Index
Adjustable Rate Mortgage
1 Year T-bill ARM(Index usually used with 1/1 ARM )
The rate is fixed for 1 year (this initial rate is sometimes referred to as the teaser or start rate) after which in the 2nd year the rate will adjust based on the 1-year treasury index which is added to a pre-determined margin (typically ranging from 2.25-3.00%) to arrive at the new annual rate. Ask what the margin, life cap and periodic payment caps of your Adjustable Rate Mortgage (ARM) will be. The loan is fully amortized (or paid off) in 30 years if the normal payment schedule is followed. (Also see anatomy of an Adjustable Rate Mortgage (ARM) for additional information).
1 Year Treasury Average Adjustable Rate Mortgage (ARM)
The rate is fixed for 1 year (this initial rate is sometimes referred to as the teaser or start rate) after which in the 2nd year the rate will adjust based on the 1-year treasury average index which is added to a pre-determined margin (typically ranging between 2.25-3.00%) to arrive at the new annual rate. Ask what the margin, life cap and periodic payment caps of your Adjustable Rate Mortgage (ARM) will be. The loan is fully amortized (or paid off) in 30 years if the normal payment schedule is followed. (Also see anatomy of an Adjustable Rate Mortgage (ARM) for additional information).
Monthly Treasury Average Adjustable Rate Mortgage (ARM) (MTA)
The rate is fixed for a 3 month period (this initial rate is sometimes referred to as the teaser or start rate) after which your rate is based on the monthly treasury average index which is added to a pre-determined margin (typically ranging between 2.25-3.00%) to arrive at the new monthly rate. This loan may also have periodic payment caps as well as interest rate caps, and therefore could have the potential for negative amortization. Ask what the margin, life cap and periodic caps of your Adjustable Rate Mortgage (ARM) will be. (Also see anatomy of an Adjustable Rate Mortgage (ARM) for additional information)
Understanding the various types of Adjustable Rate Mortgages (ARMs) and their indices is crucial for borrowers considering these financing options. The 1 Year Treasury Security, 1 Year T-bill ARM, and Monthly Treasury Average (MTA) ARM each offer different advantages and considerations based on the borrower's financial situation and the economic environment.
For instance, the MTA ARM's use of a monthly average for its index may provide a more smoothed adjustment experience compared to the potentially sharper annual adjustments of the 1 Year T-bill ARM. It's essential for borrowers to inquire about the specifics of their ARM, including the adjustment frequency, rate caps, and the index plus margin calculation, to fully understand their potential financial obligations.
Additionally, considering the potential for negative amortization with certain ARMs, like the MTA ARM, highlights the importance of understanding all loan features. Borrowers should thoroughly discuss these aspects with their lender to ensure they choose the ARM product that best aligns with their long-term financial goals and risk tolerance.
Current Mortgage Quotes
Fannie Mae & Jumbo Mortgage Rates
Just One Click! = Current Rate Chart
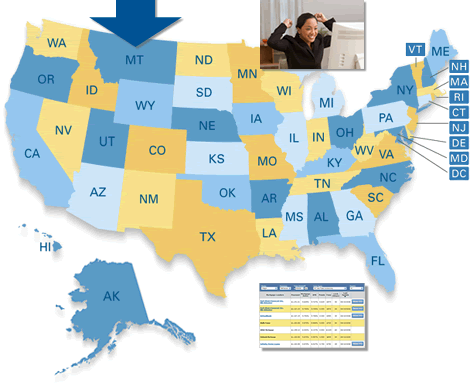
Start by selecting your state
| Jan | Feb | Mar | Apr | May | Jun | Jul | Aug | Sep | Oct | Nov | Dec | |
|---|---|---|---|---|---|---|---|---|---|---|---|---|
| 2017 | 0.83 | 0.82 | 1.01 | 1.04 | 1.12 | 1.20 | 1.22 | 1.23 | 1.28 | 1.40 | ||
| 2016 | 0.54 | 0.53 | 0.66 | 0.56 | 0.59 | 0.55 | 0.51 | 0.57 | 0.59 | 0.66 | 0.74 | 0.87 |
| 2015 | 0.20 | 0.22 | 0.25 | 0.23 | 0.24 | 0.28 | 0.30 | 0.38 | 0.37 | 0.26 | 0.48 | 0.65 |
| 2014 | 0.12 | 0.12 | 0.13 | 0.11 | 0.10 | 0.10 | 0.11 | 0.11 | 0.11 | 0.10 | 0.13 | 0.21 |
| 2013 | 0.15 | 0.16 | 0.15 | 0.12 | 0.12 | 0.14 | 0.12 | 0.13 | 0.12 | 0.12 | 0.12 | 0.13 |
| 2012 | 0.12 | 0.16 | 0.19 | 0.18 | 0.19 | 0.19 | 0.19 | 0.18 | 0.18 | 0.18 | 0.18 | 0.16 |
| 2011 | 0.27 | 0.29 | 0.26 | 0.25 | 0.19 | 0.18 | 0.19 | 0.11 | 0.10 | 0.11 | 0.11 | 0.12 |
| 2010 | 0.35 | 0.35 | 0.40 | 0.45 | 0.37 | 0.32 | 0.29 | 0.26 | 0.26 | 0.23 | 0.25 | 0.29 |
| 2009 | 0.44 | 0.62 | 0.64 | 0.55 | 0.50 | 0.51 | 0.48 | 0.46 | 0.40 | 0.37 | 0.31 | 0.37 |
| 2008 | 2.71 | 2.05 | 1.54 | 1.74 | 2.05 | 2.42 | 2.28 | 2.18 | 1.91 | 1.42 | 1.07 | 0.49 |
| 2007 | 5.06 | 5.05 | 4.92 | 4.93 | 4.91 | 4.96 | 4.96 | 4.47 | 4.14 | 4.10 | 3.50 | 3.26 |
| 2006 | 4.45 | 4.68 | 4.77 | 4.90 | 5.00 | 5.16 | 5.22 | 5.08 | 4.97 | 5.01 | 5.01 | 4.94 |
| 2005 | 2.86 | 3.03 | 3.30 | 3.32 | 3.33 | 3.36 | 3.64 | 3.87 | 3.85 | 4.18 | 4.33 | 4.35 |
| 2004 | 1.24 | 1.24 | 1.19 | 1.43 | 1.78 | 2.12 | 2.10 | 2.02 | 2.12 | 2.23 | 2.50 | 2.67 |
| 2003 | 1.36 | 1.30 | 1.24 | 1.27 | 1.18 | 1.01 | 1.12 | 1.31 | 1.24 | 1.25 | 1.34 | 1.31 |
| 2002 | 2.16 | 2.23 | 2.57 | 2.48 | 2.35 | 2.20 | 1.96 | 1.76 | 1.72 | 1.65 | 1.49 | 1.45 |
| 2001 | 4.81 | 4.68 | 4.30 | 3.98 | 3.78 | 3.58 | 3.62 | 3.47 | 2.82 | 2.33 | 2.18 | 2.22 |
| 2000 | 6.12 | 6.22 | 6.22 | 6.15 | 6.33 | 6.17 | 6.08 | 6.18 | 6.13 | 6.01 | 6.09 | 5.60 |
| 1999 | 4.51 | 4.70 | 4.78 | 4.69 | 4.85 | 5.10 | 5.03 | 5.19 | 5.25 | 5.43 | 5.55 | 5.84 |
| 1998 | 5.24 | 5.31 | 5.39 | 5.38 | 5.44 | 5.41 | 5.36 | 5.21 | 4.71 | 4.12 | 4.53 | 4.52 |
| 1997 | 5.61 | 5.53 | 5.80 | 5.99 | 5.87 | 5.69 | 5.54 | 5.56 | 5.52 | 5.46 | 5.46 | 5.53 |
| 1996 | 5.09 | 4.94 | 5.34 | 5.54 | 5.64 | 5.81 | 5.85 | 5.85 | 5.83 | 5.55 | 5.42 | 5.47 |
| 1995 | 7.05 | 6.70 | 6.43 | 6.27 | 6.00 | 5.64 | 5.59 | 5.75 | 5.62 | 5.59 | 5.43 | 5.31 |
| 1994 | 3.54 | 3.87 | 4.32 | 4.82 | 5.31 | 5.27 | 5.48 | 5.56 | 5.76 | 6.11 | 6.54 | 7.14 |
| 1993 | 3.50 | 3.39 | 3.33 | 3.24 | 3.36 | 3.54 | 3.47 | 3.44 | 3.36 | 3.39 | 3.58 | 3.61 |
| 1992 | 4.15 | 4.29 | 4.63 | 4.30 | 4.19 | 4.17 | 3.6 | 3.47 | 3.18 | 3.30 | 3.68 | 3.71 |
| 1991 | 6.64 | 6.27 | 6.40 | 6.24 | 6.13 | 6.36 | 6.31 | 5.78 | 5.57 | 5.53 | 4.89 | 4.38 |
| 1990 | 7.92 | 8.11 | 8.35 | 8.40 | 8.32 | 8.10 | 7.94 | 7.78 | 7.76 | 7.55 | 7.31 | 7.05 |
| 1989 | 9.05 | 9.25 | 9.57 | 9.36 | 8.98 | 8.44 | 7.89 | 8.18 | 8.22 | 7.99 | 7.77 | 7.72 |
| 1988 | 6.99 | 6.64 | 6.71 | 7.01 | 7.40 | 7.49 | 7.75 | 8.17 | 8.09 | 8.11 | 8.48 | 8.99 |
| 1987 | 5.78 | 5.96 | 6.03 | 6.5 | 7 | 6.8 | 6.88 | 7.03 | 7.67 | 7.59 | 6.96 | 7.17 |
| 1986 | 7.73 | 7.61 | 7.03 | 6.44 | 6.65 | 6.73 | 6.27 | 5.93 | 5.77 | 5.72 | 5.8 | 5.87 |
| 1985 | 9.02 | 9.29 | 9.86 | 9.14 | 8.46 | 7.8 | 7.86 | 8.05 | 8.07 | 8.01 | 7.88 | 7.68 |
The 1 Year T-Bill Index is the most commonly offered index for Adjustable Rate Mortgages. It is considered to be more volatilte than the COFI Index (11th District Cost of Funds Index)
Webmasters please feel free to link to this page.
Just copy and paste this code into your site:

Get the Updated and Improved Mortgage Rates App from ERATE.com

- Why housing consumers say you need a real estate agent
- Lenders Double Down on Car-Title Loans Attempting to Stay Ahead of Regulators
- Need Cash Fast? Beware of Greedy Lenders Waiting to Exploit You
- Mortgage Rates and the Stock Market: Understanding the Relationship
- The ERATE® Resource Guide to No-Closing-Cost Refinancing
- You and Your Credit; Make it a Happy Ongoing Relationship
- Principal Reduction: New Programs, More Controversy
- Understanding Mortgages: Mortgage Paperwork
- What is Mortgage Interest?
- Mortgage Terms & Definitions
- Understanding Mortgages: Types of Mortgages
- Understanding Mortgages: How to Get a Mortgage
- What is a Short Sale?
- Understanding Mortgages: Buy or Rent?
- Understanding Mortgages: Working with a Real Estate Agent
- Understanding Mortgages: Working with a Real Estate Agent
- Understanding Credit Cards: Top Mistakes
FREE Mortgage Rate Widgets
Your State's Rates or National Rates Get this Widget for any State you want