Daily Rate Summary
Thursday, August 17th, 2017
Mortgage Rates and Treasury Yields Fall Slightly.
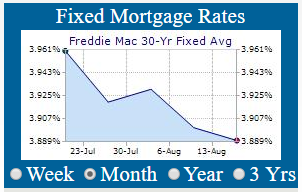
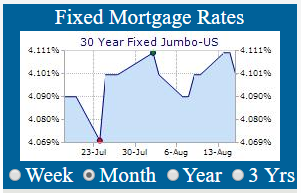
On Wednesday, Treasury bond yields and Mortgage interest rates fell slightly as Credit Market participants place bets on volatility and the near-term direction of interest rates in ‘quiet’ period in August. The September 10 Yr. U.S. Treasury Note stood at a yield of 2.2220% and the 30 Yr. U.S. Treasury Bond is yielding 2.8073%. 30 Year Mortgages according to Freddie Mac were around 3.89% for conforming and 4.10% for Jumbo products.
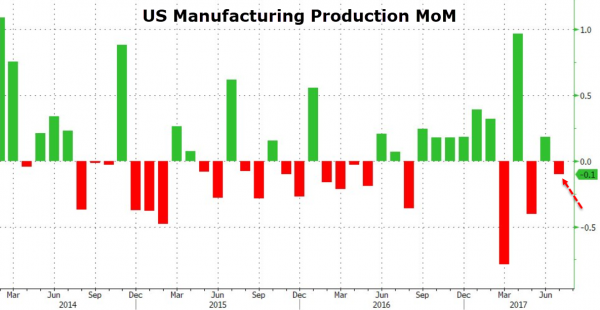
Industrial Production, released early, rose just 0.2% MoM in July, missing expectations and slowing from last month's 0.4% gain. Manufacturing production actually shrank (-0.1%)... The biggest driver of the decline was a 3.6% slump in motor vehicle production...Automobile manufacturers normally shutdown a couple of weeks during summer for inventory balancing and model year changeovers.
July Manufacturing Production Falls -0.1 MoM.
(Chart courtesy of Zerohedge.com).
There are however real (non-seasonal) problems brewing in the Automobile Industry presently with a glut of late-model cars, suv’s, and trucks coming off leases. Prices are softening for used cars which could impact new car pricing and the rate of sales in the coming year. Look for a slowdown in new auto sales as willing sub-prime customers become scarce in 2018 in all likelihood.
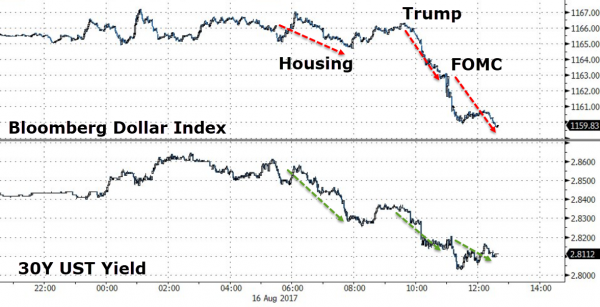
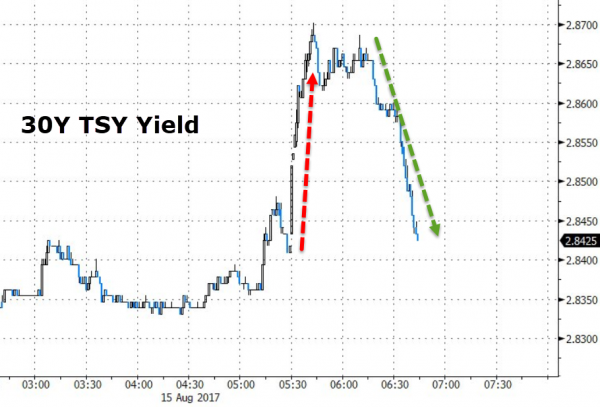
30 Year U.S. Treasury Bond Yield falls to 2.8425% then falls further to 2.8073%
(Chart courtesy of Zerohedge.com).
This week should provide confirmation of the direction of economic activity and the pace of the recovery and further confirm the path for the economy and interest rate policy. The Jackson Hole Symposium will kick off next week.
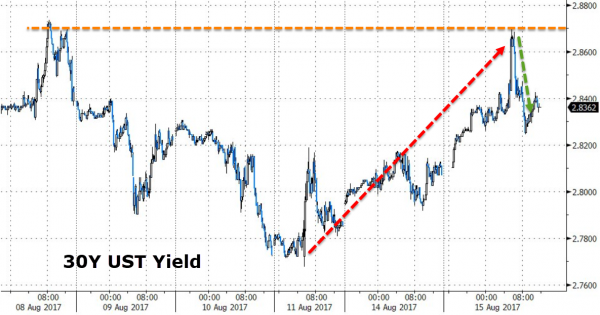
30 Year U.S. Treasury Bond Yield spike above 2.87% then steadies at 2.8073%
(Chart courtesy of Zerohedge.com).
The 30 Year U.S. Treasury Bond has now extended its trading range to below 2.80% and may be presaging lower yields and a new lower trading range.
30 Year U.S. Treasury Bond Yield Testing lower range between 2.80% and 2.94%.
(Chart courtesy of Zerohedge.com).
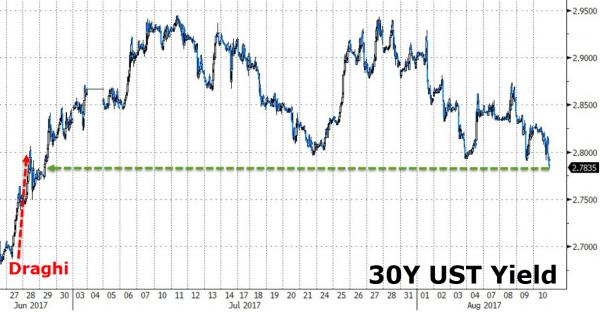
At the extremes of this range buyers of long bonds can be counted on to appears in force when the 30 Year U.S. Treasury Yield moves to the top of this range around 2.94%; conversely, sellers come out when the yield falls to 2.80%.
10 Year U.S. Treasury Note Yield Rises to 2.2728% then falls at 2.2220%
(Chart courtesy of Zerohedge.com).
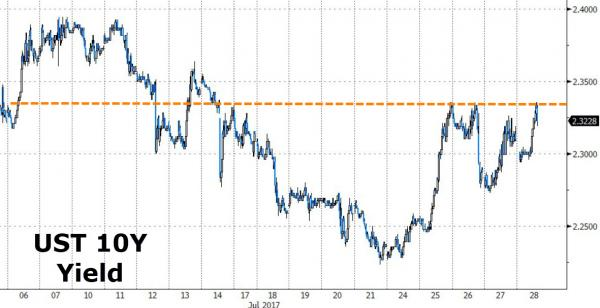
This gyration in bond yields looks like it wants to resolve itself by moving much lower into the gap that was formed post-election last November. If so, we will get another run at historically low rates before the final blow-off in Credit Markets sends Mortgage Interest rates up for good.
10 Year U.S. Treasury Note Yield Longer-term View back below 50-Day MA at 2.26%
(Chart courtesy of Zerohedge.com).
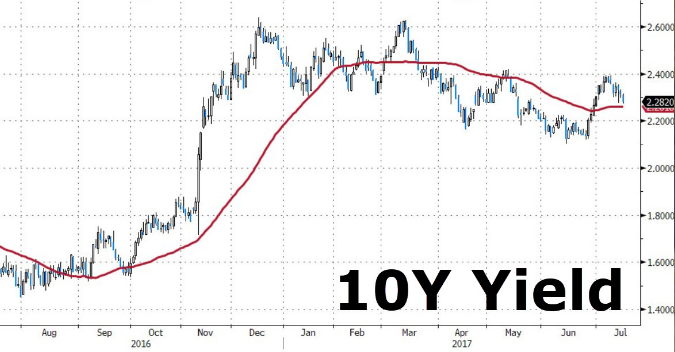
The above Chart does suggest that a constructive set-up is forming in the 10 Year Treasury Note with the potential to push the yield to around 2.00% over the next month. It is crucial that Mortgage Rates stay at or below 4.00% or demand for mortgage loans will dry up. The window of opportunity for borrowers seeking mortgage refinancing & home purchases is still open for now.
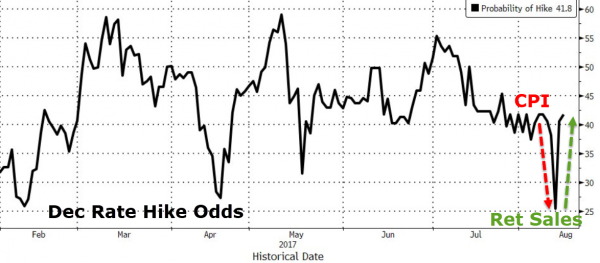
December Fed Funds Futures Rate Hike Odds Increase to 41.8%
(Chart courtesy of Zerohedge.com).
Weekly Mortgage Rates Analysis
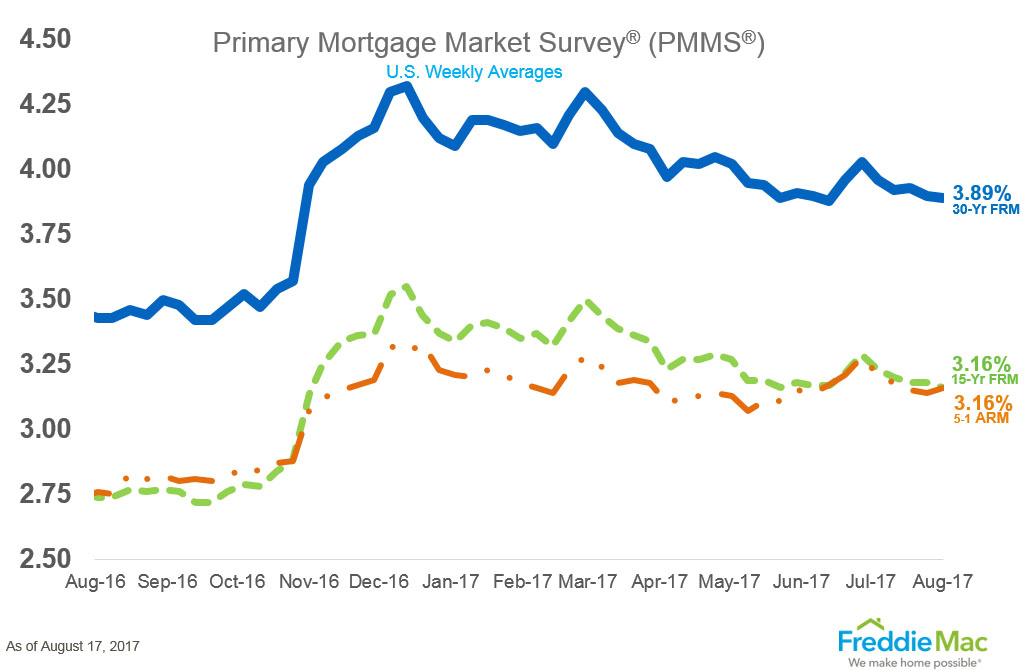
As can be seen from Freddie Mac’s Mortgage Market Survey, last week, 30 Yr. Fixed Mortgage rates for conforming loans hit 3.89% with the rate falling 0.01% basis points from the previous week.
Treasury Prices Rise and Yields Fall for U.S. 10 Yr. and 30 Yr. Treasuries.
At the Chicago Board of Trade (CBOT): the US 10 Year Treasury Note futures Contract for September settlement closed at a price of 126’16.5 / 32nds; the 10 Year Note was up 11.5 basis points (bps) on the day, yielding 2.2220%. The US 30 Year Treasury Bond futures Contract for Sept. settlement closed at a price of 155’02 / 32nds; the 30 Year Bond was up 21 basis points (bps) on the day, yielding 2.8073%. Mortgage Rates have come off their 2017 lows and are down 0.01% bps from the previous Freddie Mac Survey last week.
Thanks to ZeroHedge.com, Goldman Sachs, Bloomberg.com, and FreddieMac.com for Charts and Graphics.
Disclaimer: The Information & content in this message is solely the opinion of the author and believed to be from reliable sources. Charts and tables contained herein were taken from other sources and a best effort was attempted by the author to give attribution where possible. None of this material should be construed as fact, and is not intended for use by reader as investment advice or relied upon for making financial decisions.

Get the Updated and Improved Mortgage Rates App from ERATE.com

- Why housing consumers say you need a real estate agent
- Lenders Double Down on Car-Title Loans Attempting to Stay Ahead of Regulators
- Need Cash Fast? Beware of Greedy Lenders Waiting to Exploit You
- Mortgage Rates and the Stock Market: Understanding the Relationship
- The ERATE® Resource Guide to No-Closing-Cost Refinancing
- You and Your Credit; Make it a Happy Ongoing Relationship
- Principal Reduction: New Programs, More Controversy
- Understanding Mortgages: Mortgage Paperwork
- What is Mortgage Interest?
- Mortgage Terms & Definitions
- Understanding Mortgages: Types of Mortgages
- Understanding Mortgages: How to Get a Mortgage
- What is a Short Sale?
- Understanding Mortgages: Buy or Rent?
- Understanding Mortgages: Working with a Real Estate Agent
- Understanding Mortgages: Working with a Real Estate Agent
- Understanding Credit Cards: Top Mistakes
FREE Mortgage Rate Widgets
Your State's Rates or National Rates Get this Widget for any State you want